Article V, Measured in People
Timothy J. Miano
Article V requires three-quarters of the states to ratify a constitutional amendment. This fact sheet measures what the state-counting rule represents in population, recorded votes, and modeled state-legislature seats, using census data and a sourced ledger of state actions.
Status. Working paper, not peer reviewed. Most post-founding ratification dates come from secondary compilations and are being re-sourced to primary records, so threshold shares, final shares, rejections, and rescissions are provisional. See the methods page.
Abstract and overview
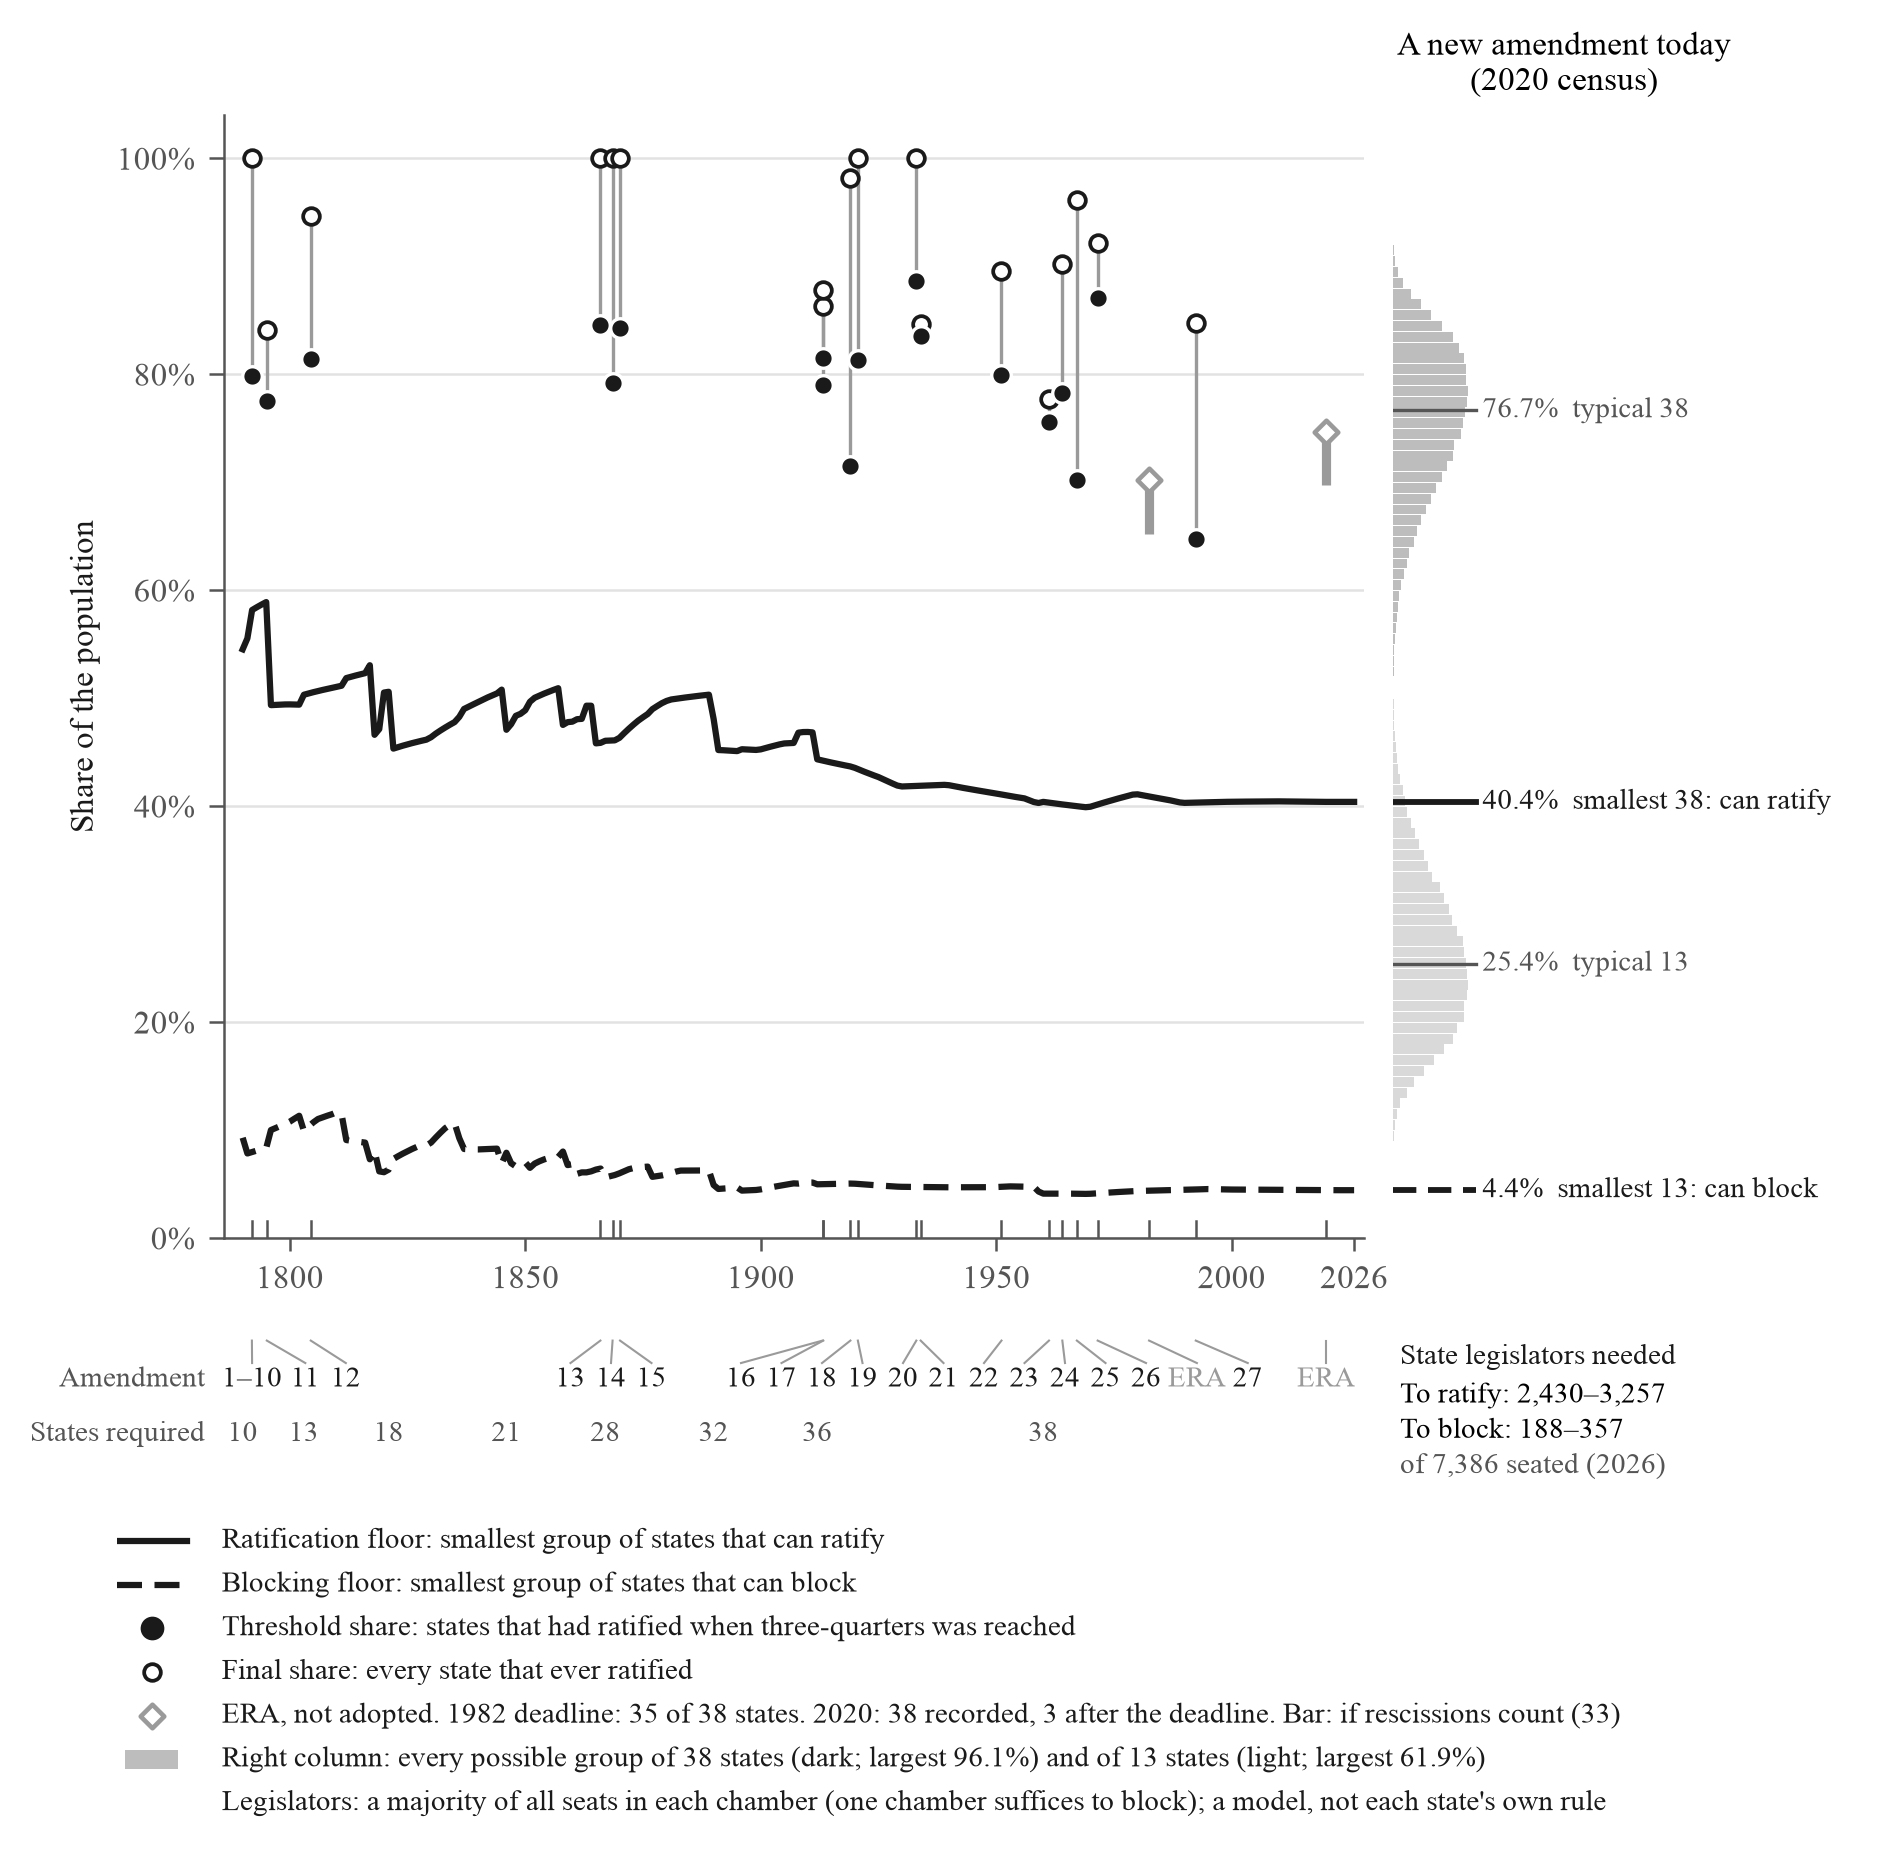
Article V counts states. This fact sheet restates the rule and each use of it in people and in state legislators. The smallest group of states that can ratify holds 40.4% of the population in 2026, down from 54.5% in 1790. Admissions account for the decline; in other years the floor rose on net. Since 1959 it has remained between 39.9% and 41.1%. The smallest group that can block holds 4.4%. Across ratification events, threshold coalitions held an average of 79.3% of the population. A model using majorities of legislative seats estimates how many state legislators could ratify or block and how much population those groups represent. Each result is a computation or count, not a stipulation.

What the rule allows
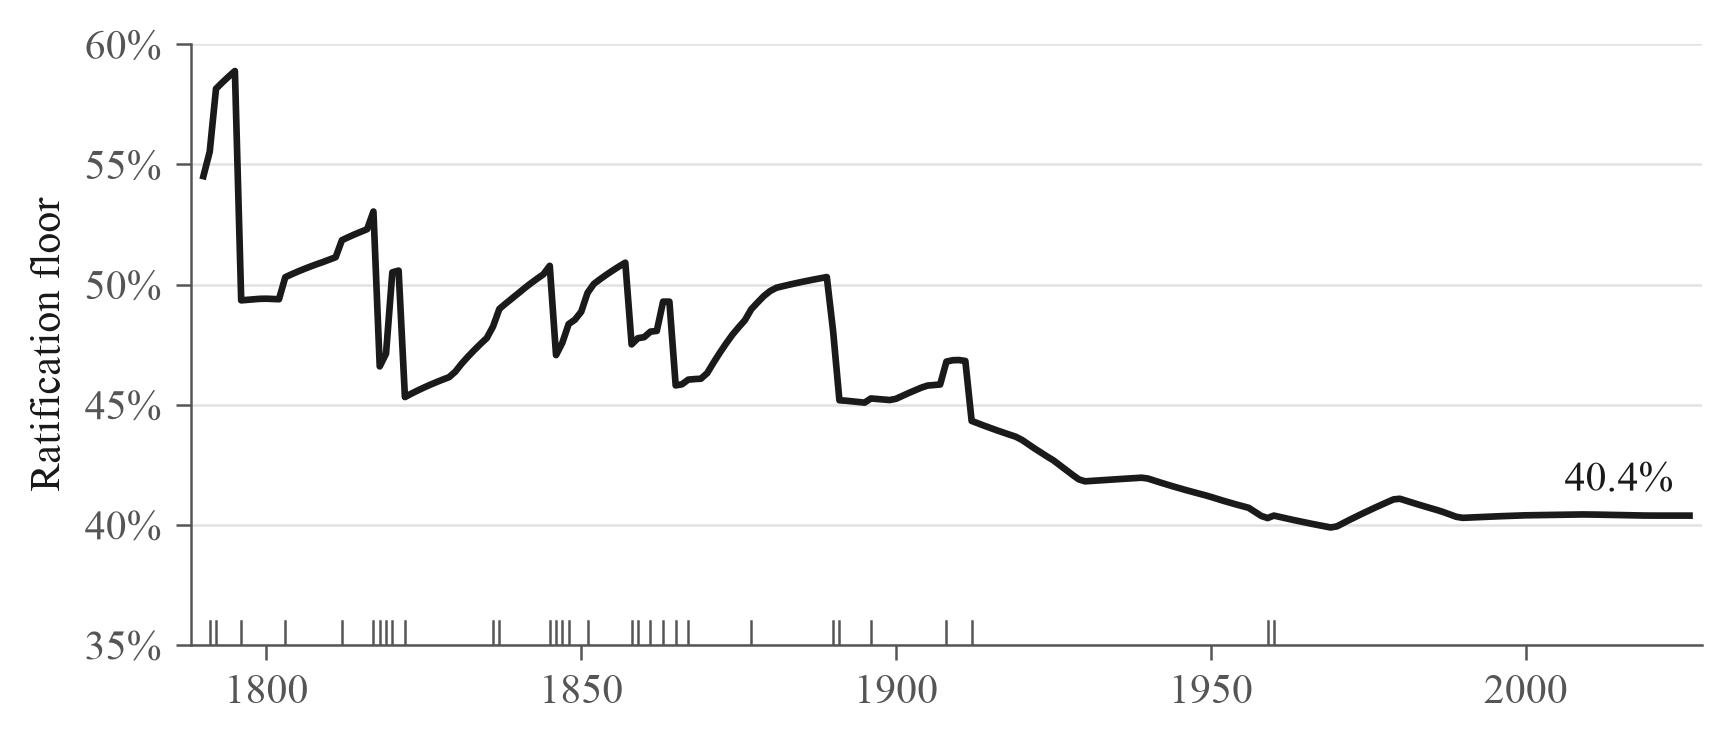
The ratification floor is 40.4% today, down from 54.5% in 1790.
Most of the decline came in steps when states were admitted; between admissions it drifts with population. Since the admissions of Alaska and Hawaii in 1959 it has stayed between 39.9% and 41.1%.
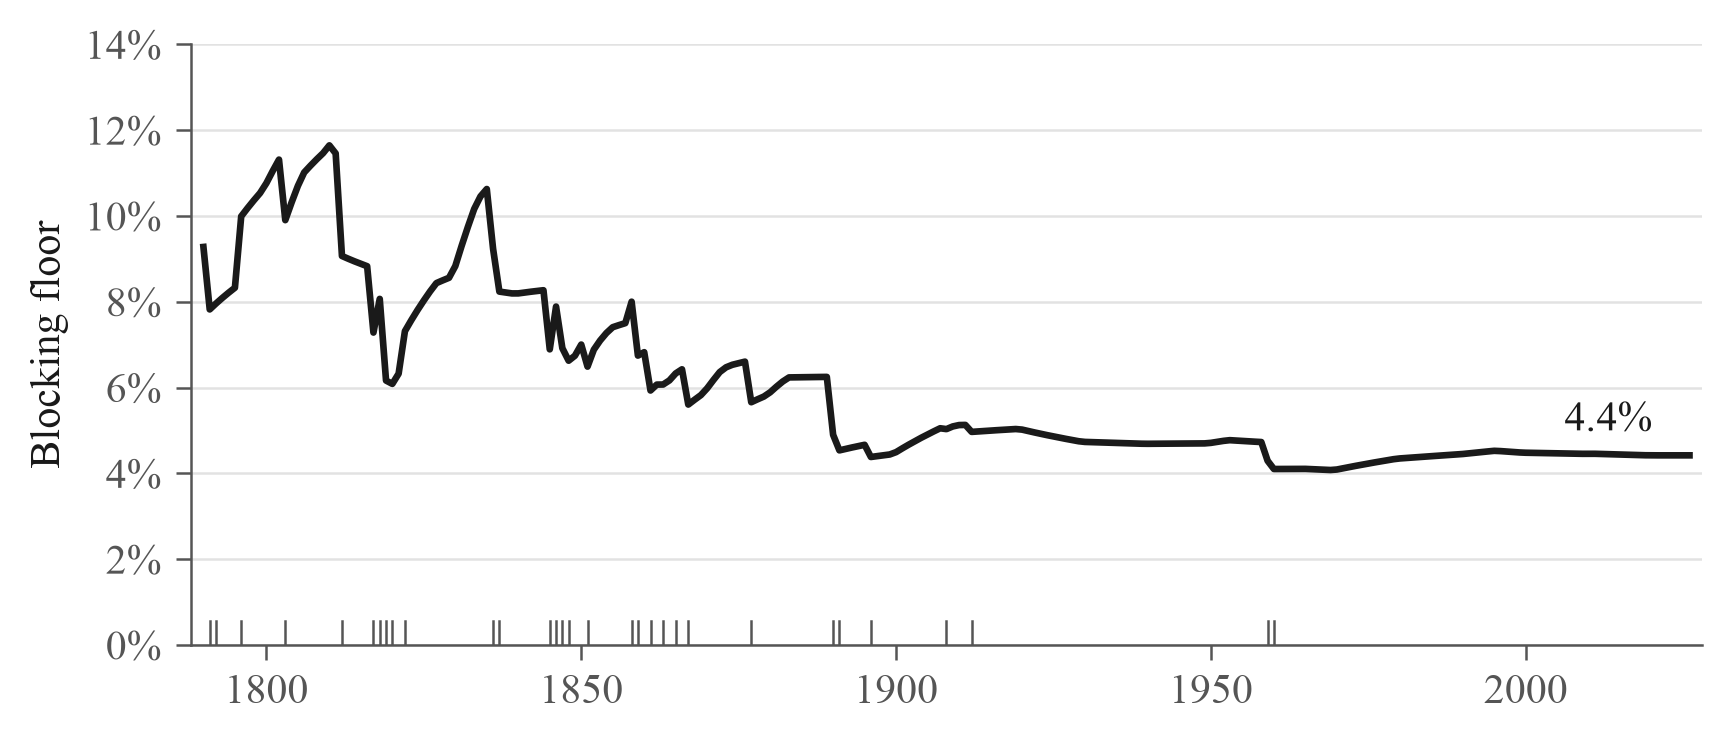
The blocking floor is 4.4% today, down from 9.3% in 1790.
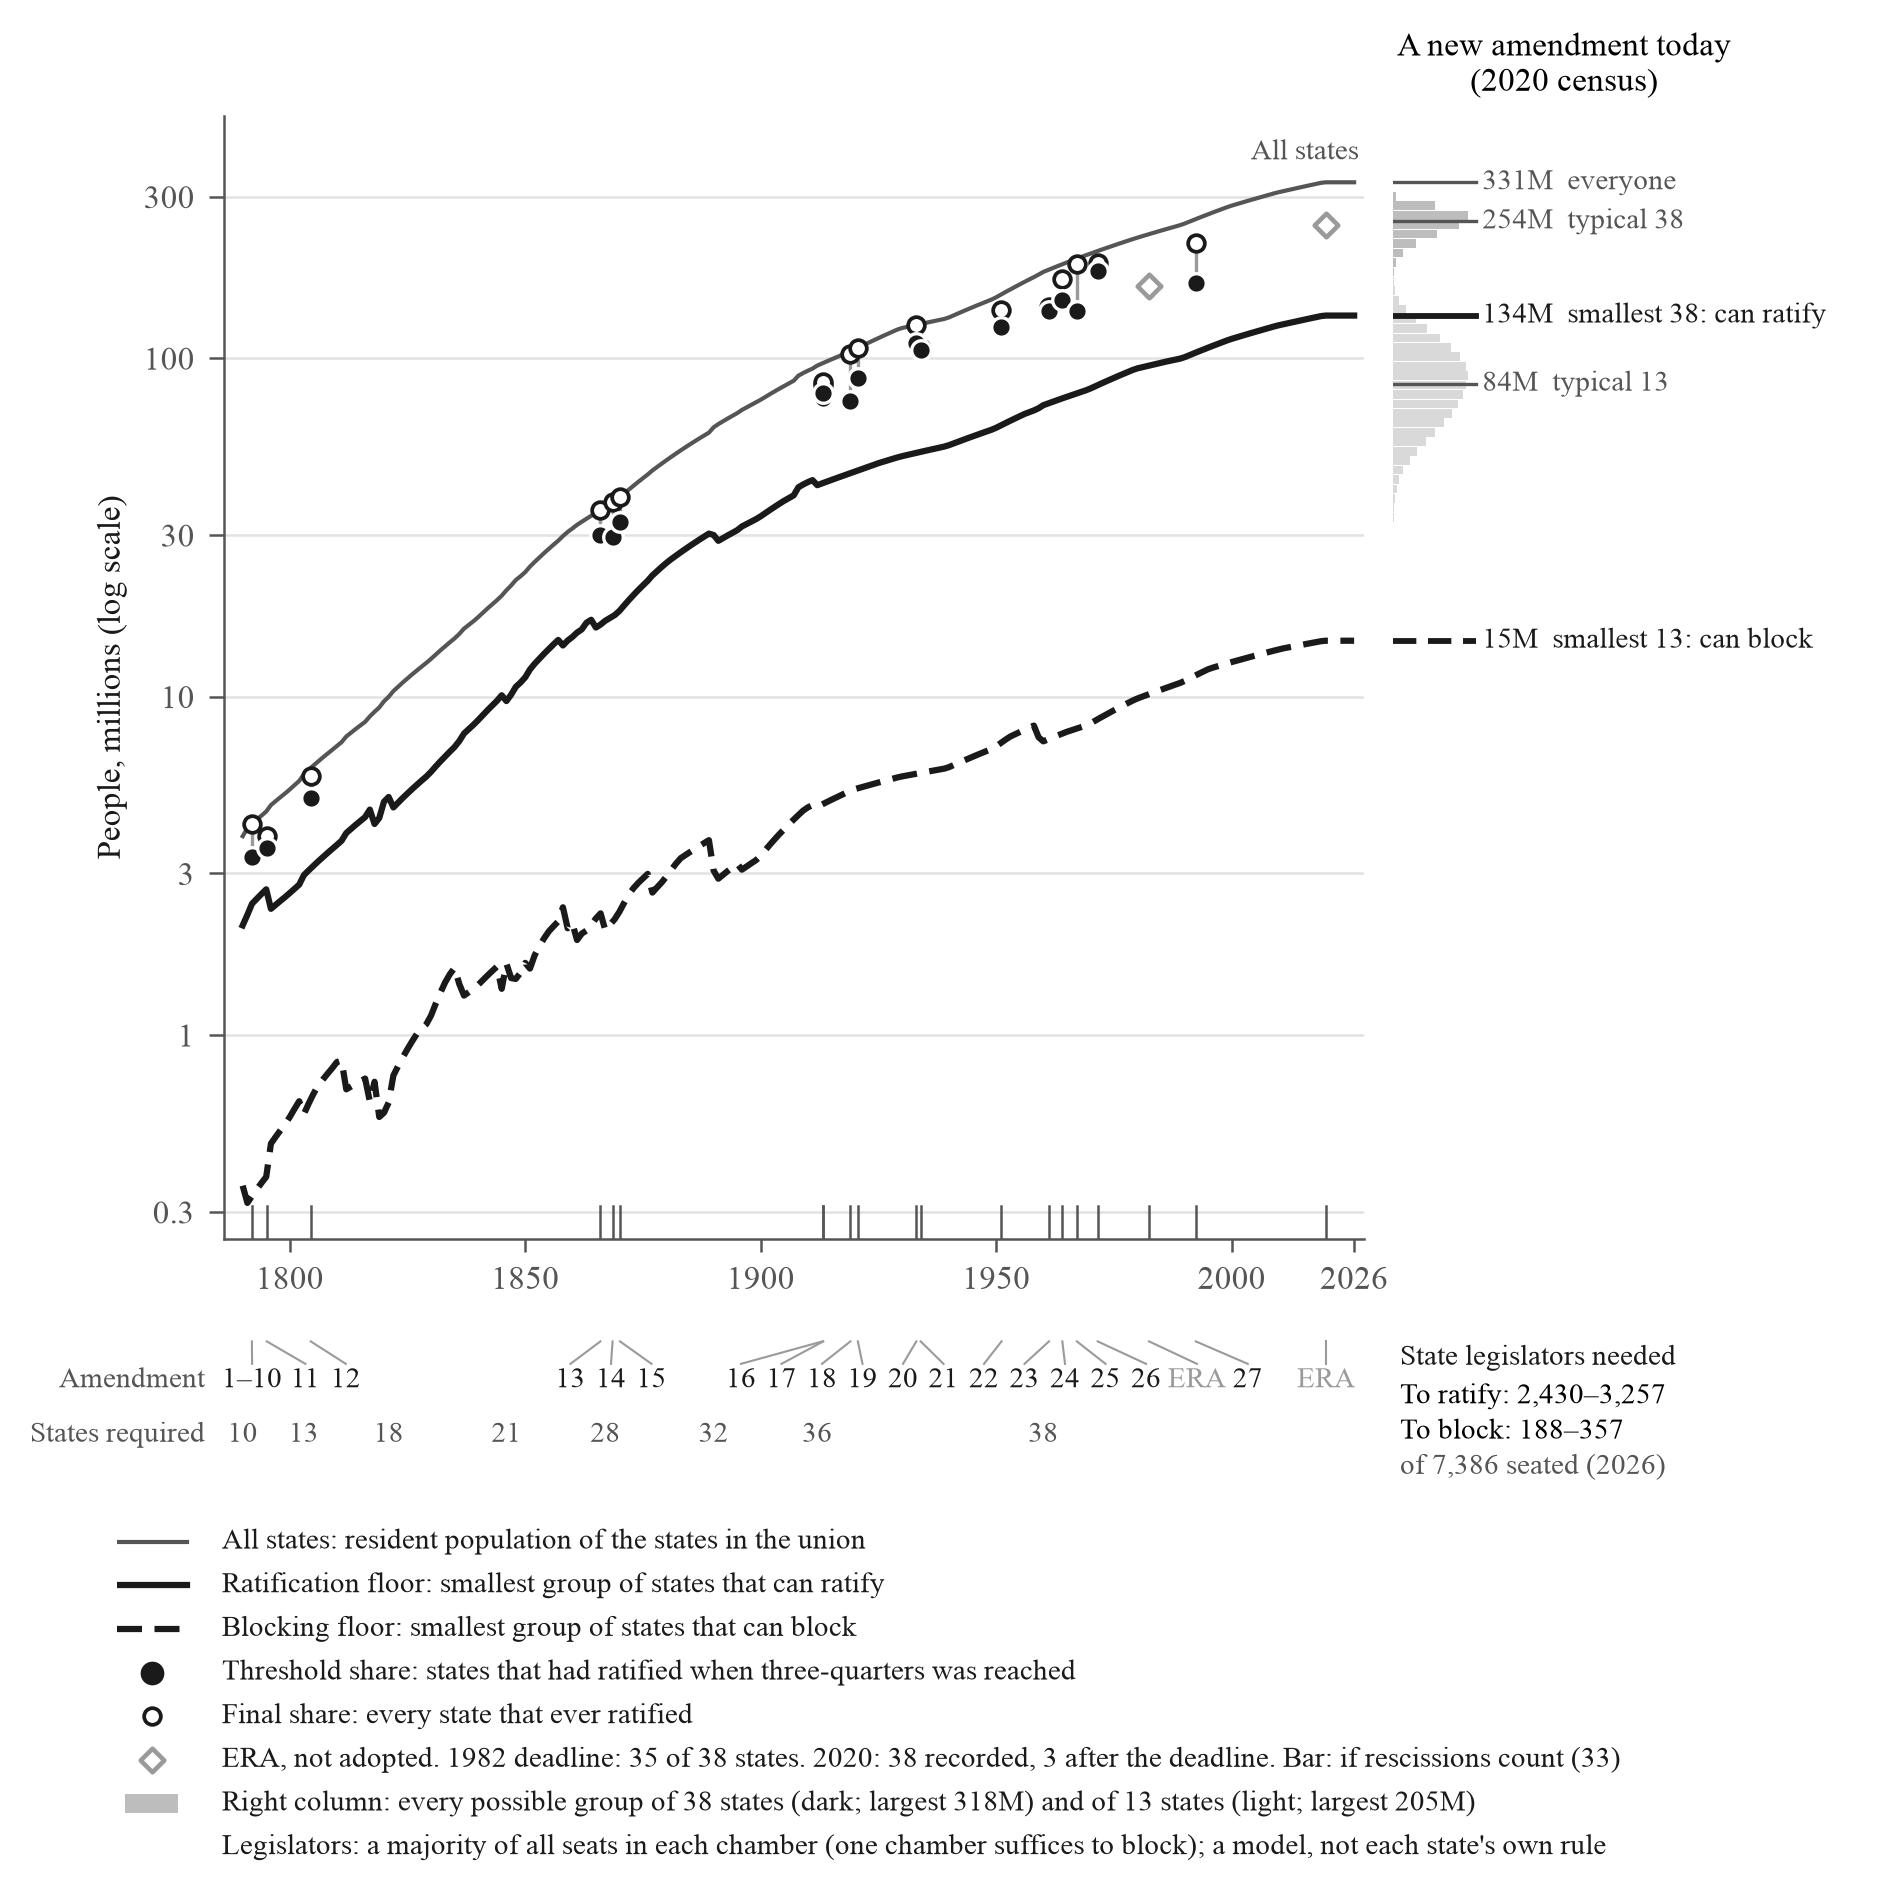
Thirteen states can block an amendment today. The 13 smallest hold 4.4% of the population.
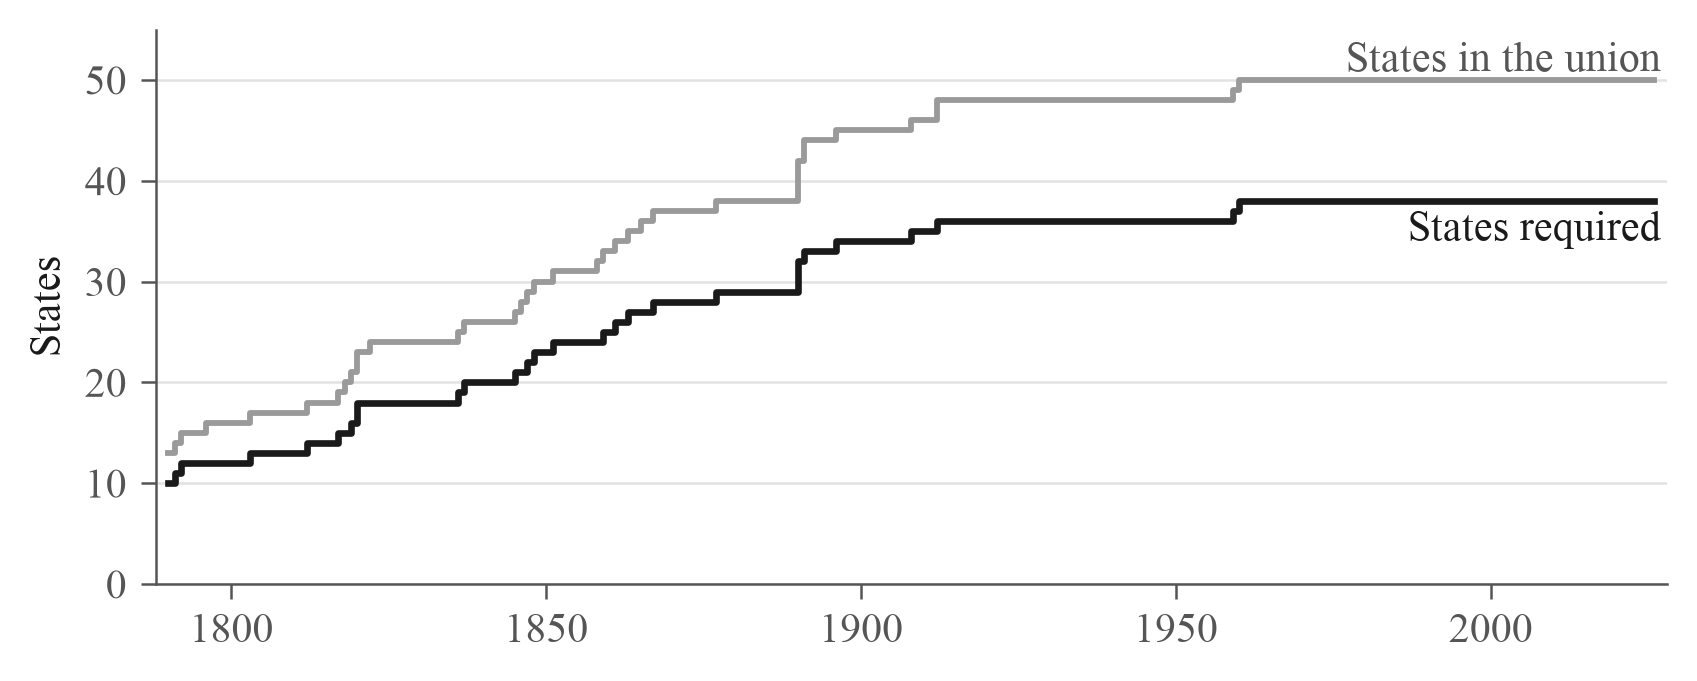
Ratification requires 38 states today, up from 10 in 1790.
Three-quarters of the states in the union, rounded up. The requirement has been 38 since 1960.
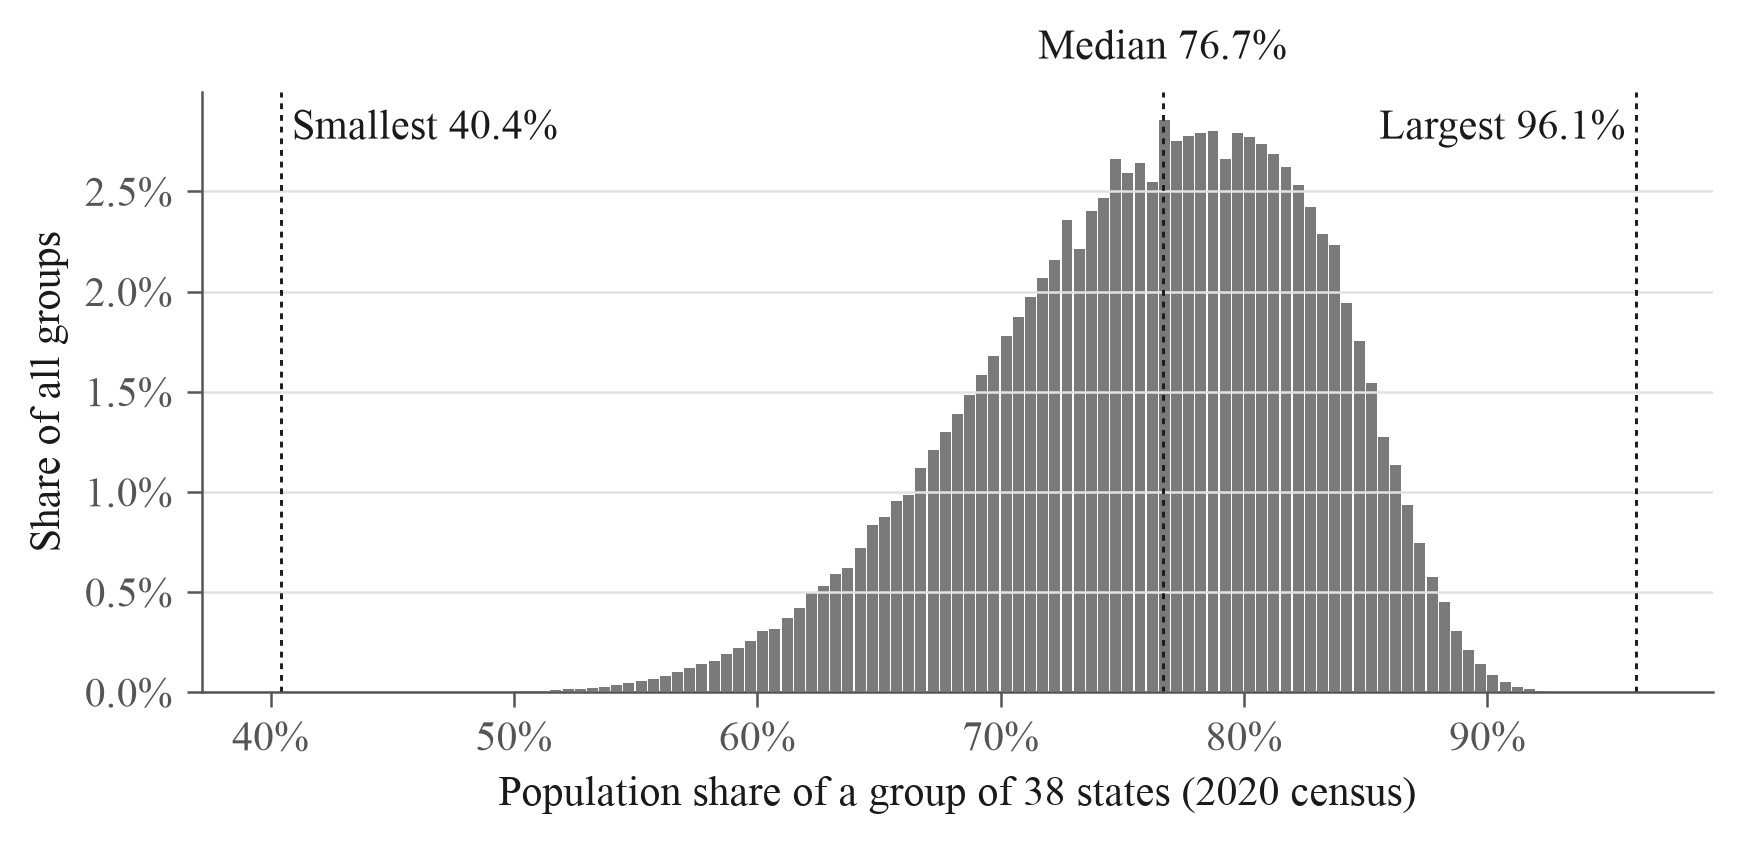
The median group of 38 states holds 76.7% of the population.
There are 121.4 billion possible groups of 38 of the 50 states. The smallest holds 40.4% and the largest 96.1%. The enumeration is exact; the histogram uses 0.5-point bins, so the displayed median is approximate to about half a point.
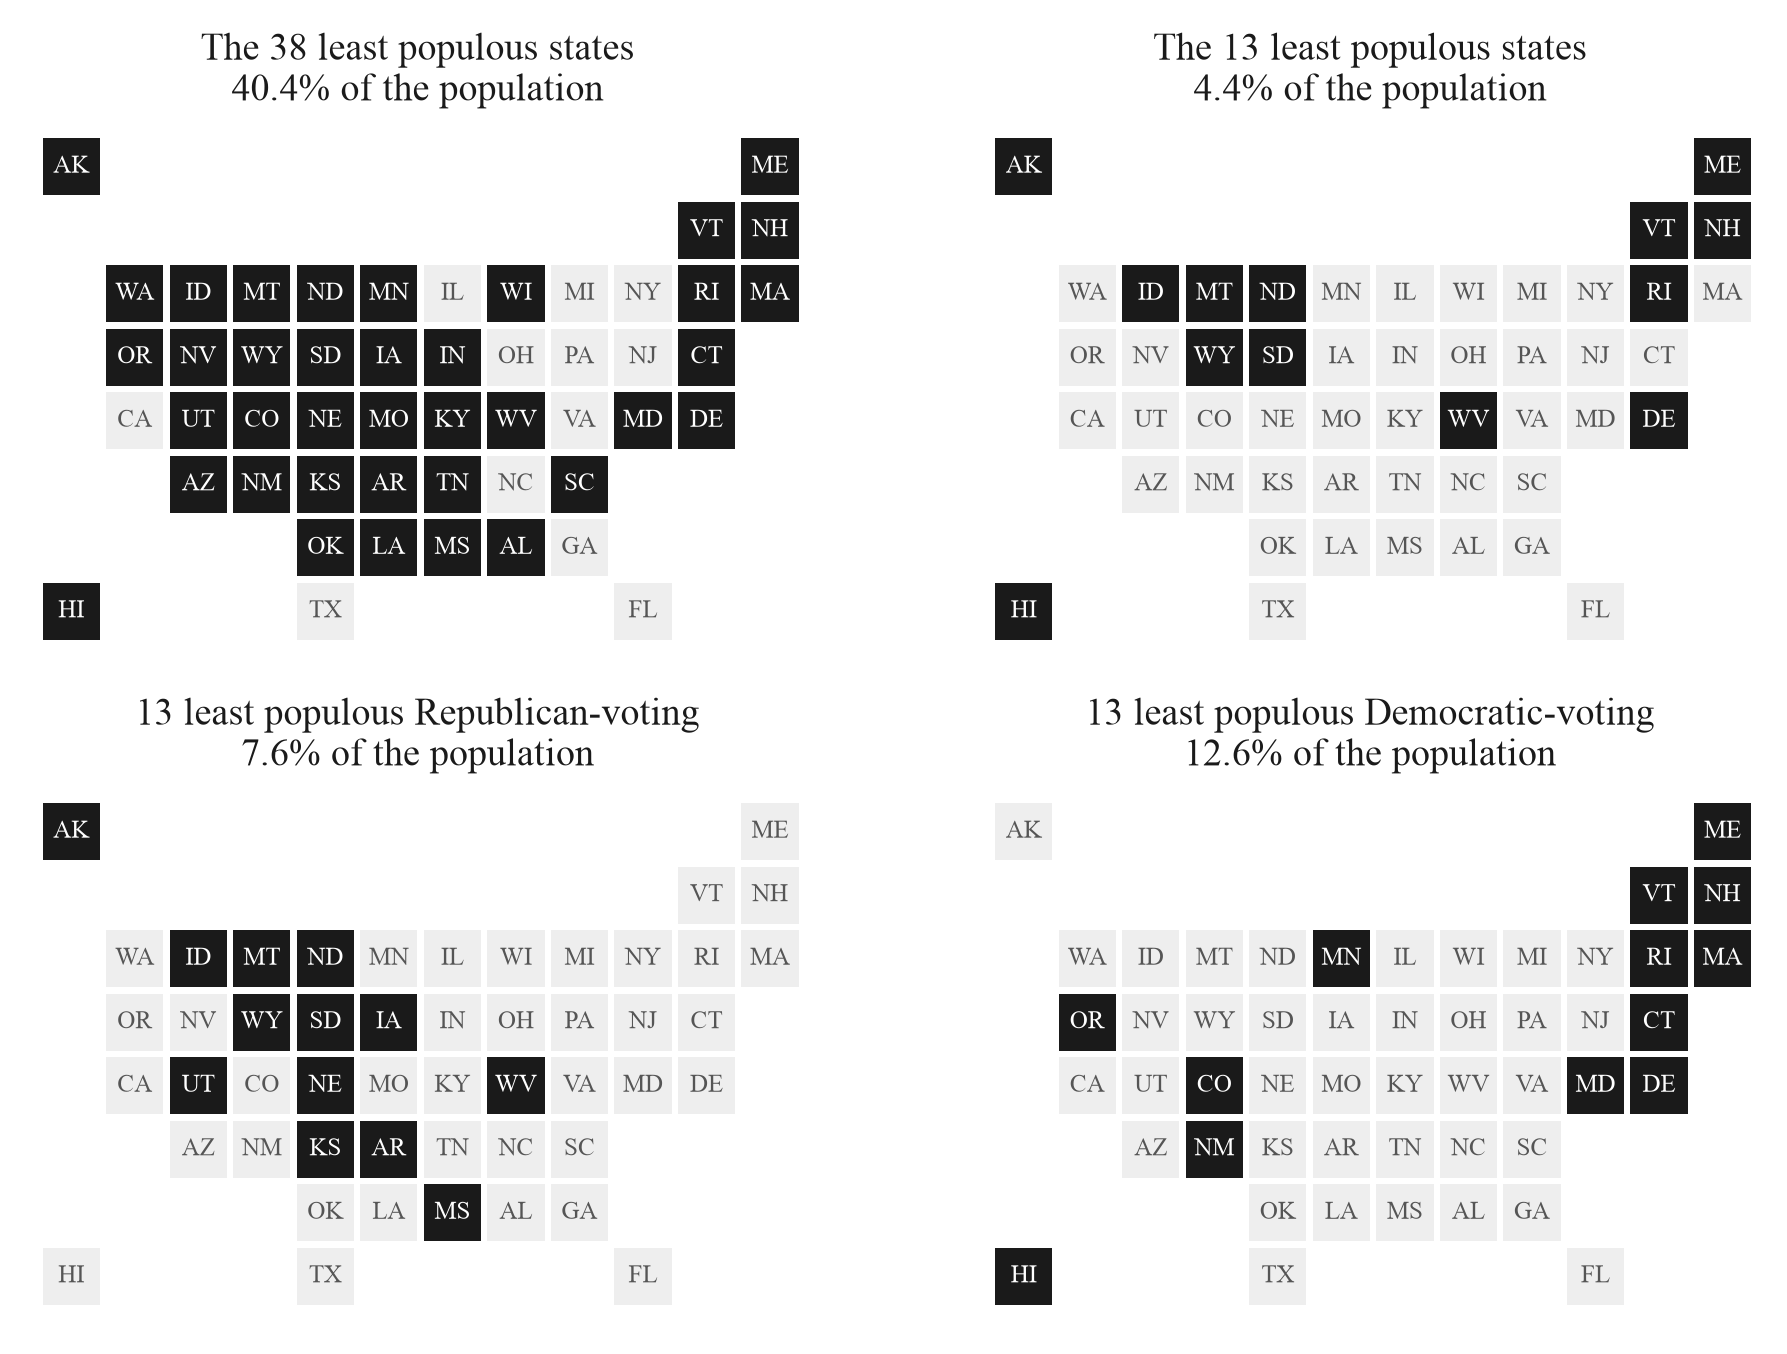
Among states that voted alike, the blocking floor is 7.6% (Republican) or 12.6% (Democratic).
These are the 13 smallest states that voted for the same party in the 2016, 2020, and 2024 presidential elections. The 13 smallest states overall hold 4.4%; seven voted Republican and six Democratic in each election from 2012 to 2024.
Admitting DC would raise the ratification floor to 40.5%; admitting DC and Puerto Rico would lower it to 38.8%.
DC raises the number of states required from 38 to 39. Puerto Rico adds a state without raising it further. Both use 2020 census populations.

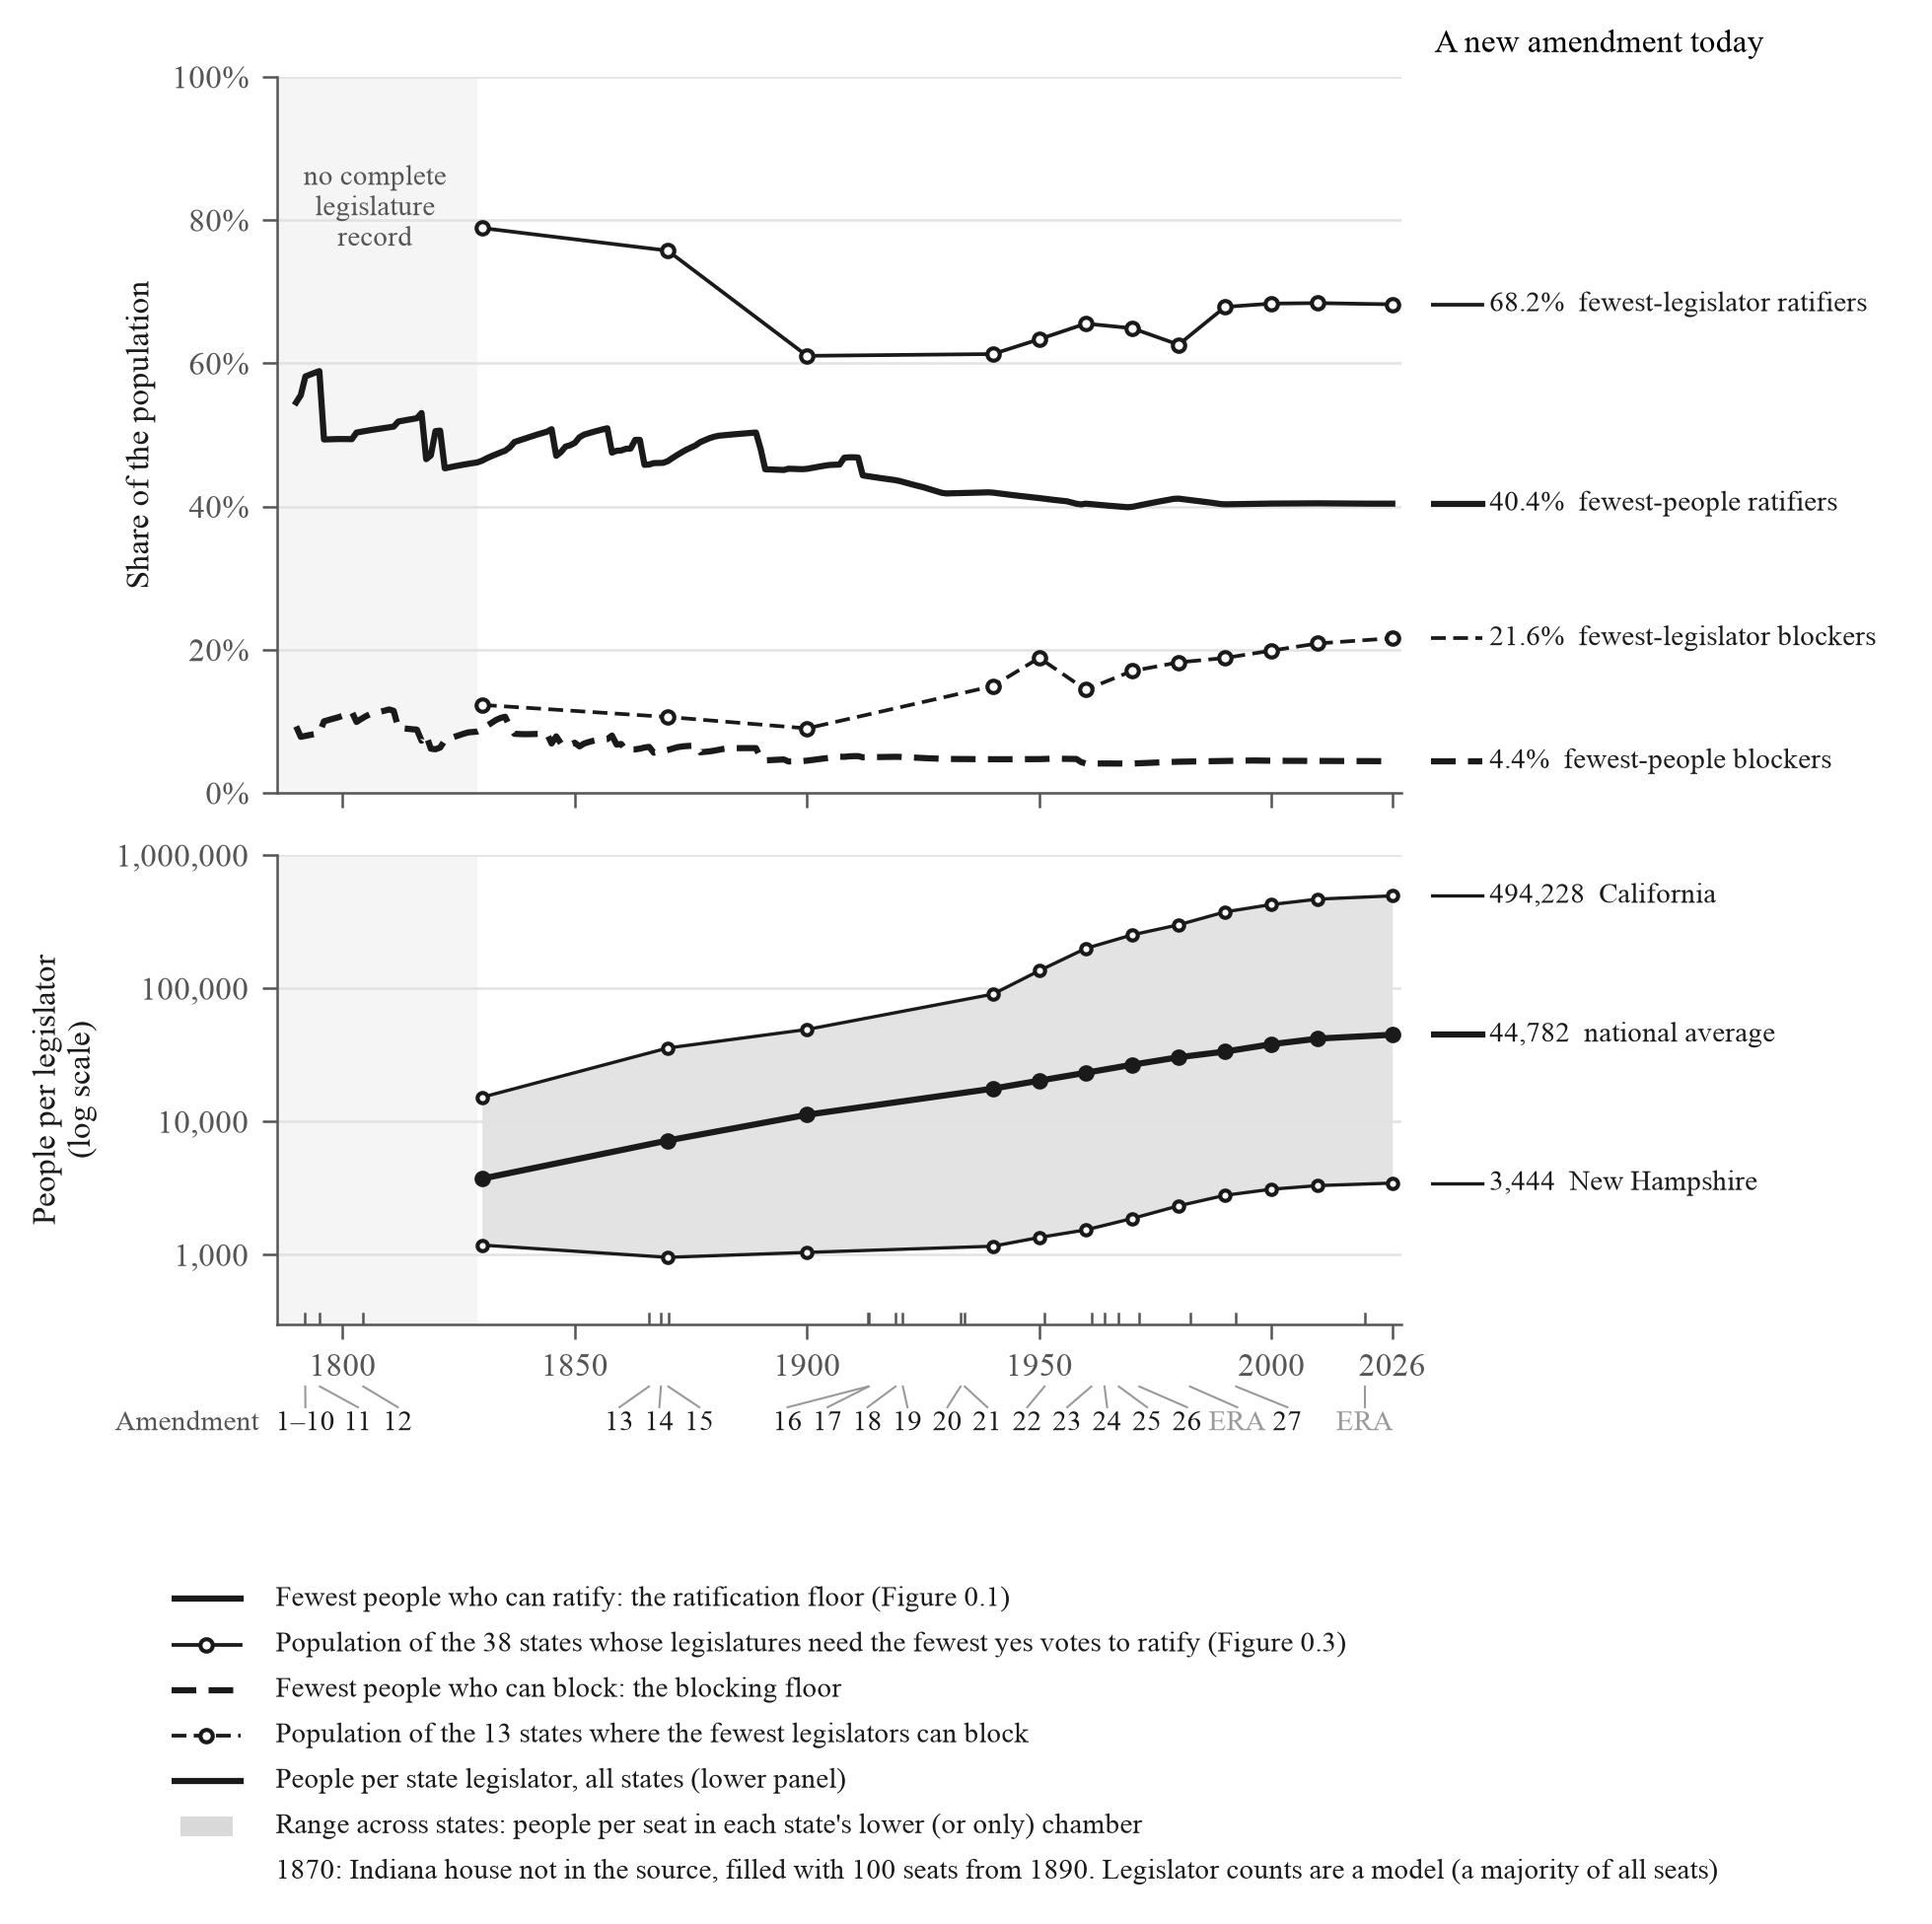
A seat-majority model gives 2,430–3,257 legislators needed to ratify and 188–357 to block today.
The range reflects which 38 states have the fewest or most legislators needed for chamber majorities; for a blocking coalition it compares the 13 smallest or largest one-chamber majorities. The model covers 7,386 seated legislators in 2026 and does not encode each state's actual ratification rule.
What ratifications delivered
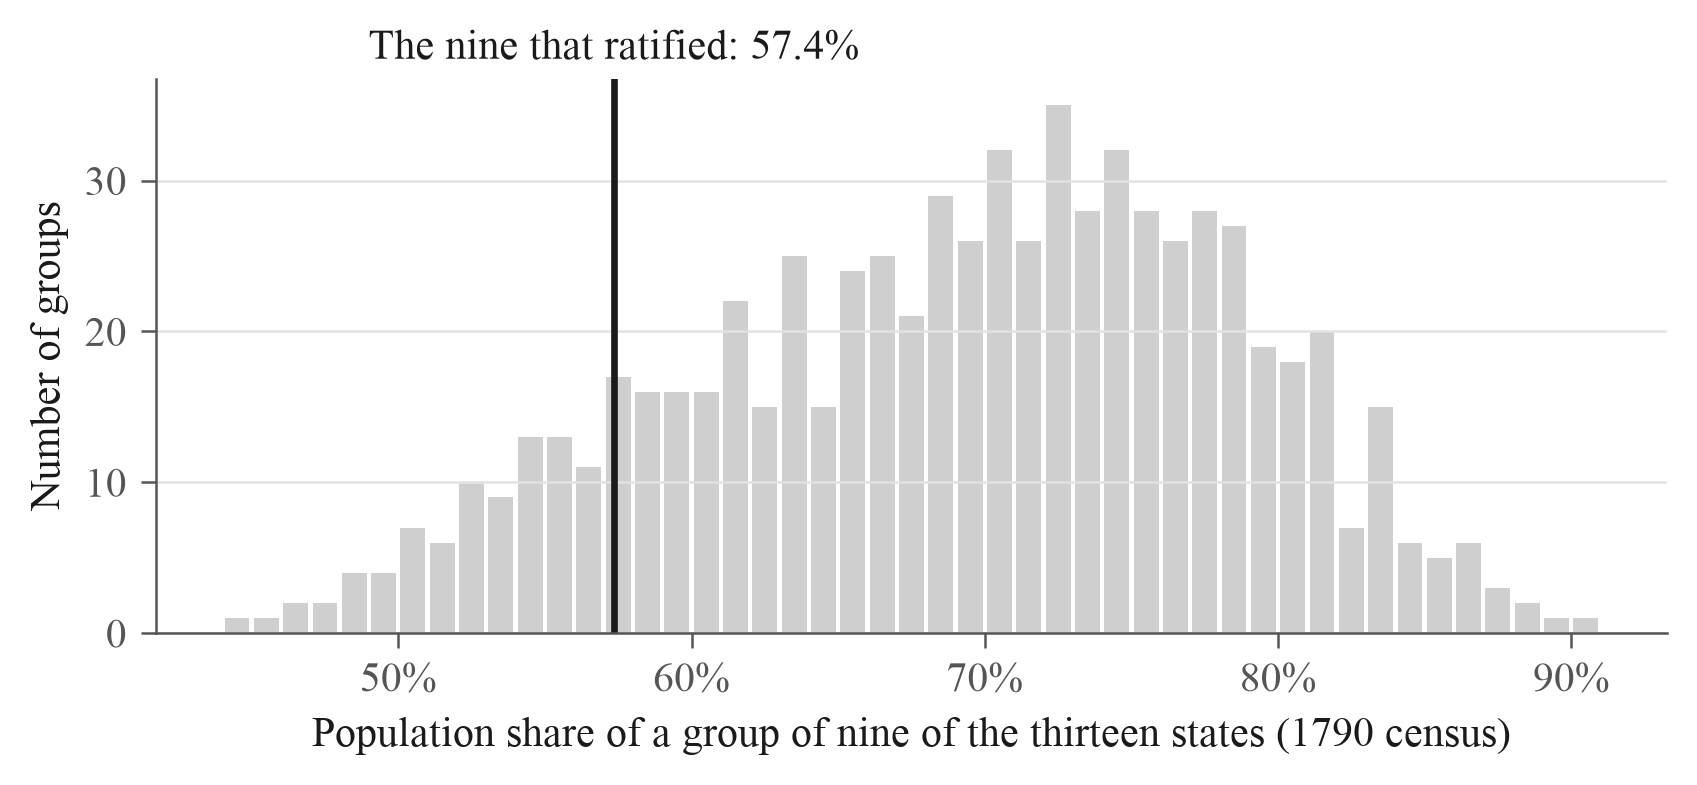
The nine states that put the Constitution into effect held 57.4% of the 13 states' population.
New Hampshire was the ninth to ratify, on June 21, 1788. Of the 715 possible groups of nine states, 88 held less than 57.4% and 627 held more. The median group held 70.2%. Virginia and New York had not yet ratified.
Threshold shares averaged 79.3%, against an average ratification floor of 44.7%.
The lowest threshold share was 64.7% (27th Amendment). The smallest margin above the floor was 18.7 points (11th Amendment).
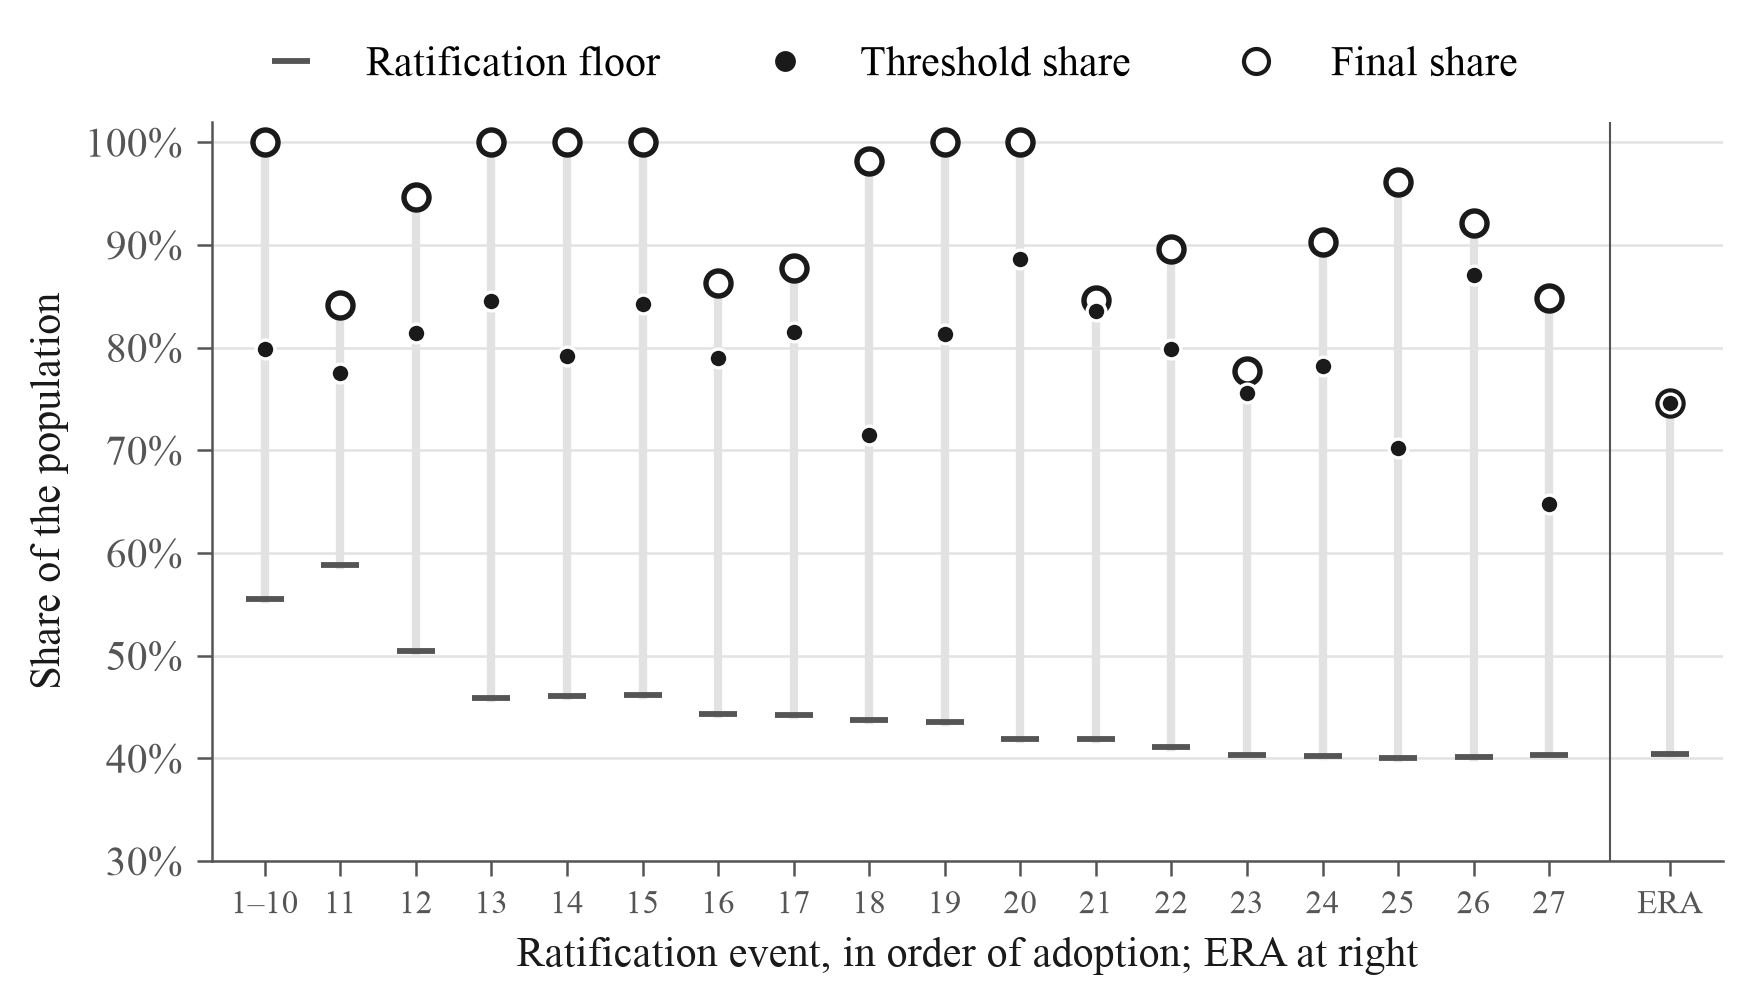
Final shares averaged 92.6%.
All 18 ratification events gained states after adoption. Six eventually had every state then in the union. The ERA gained none after its 38th state. Shown in the chart above.
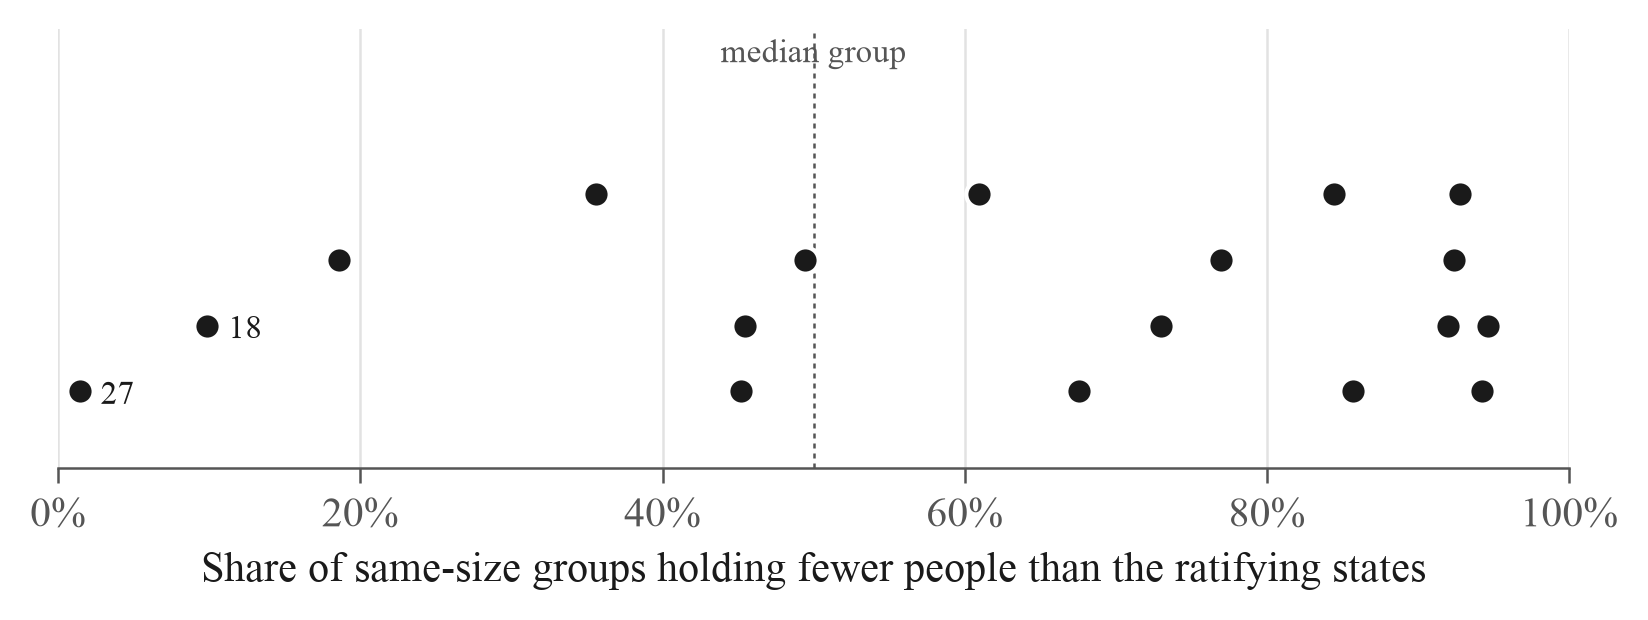
Ratifying states held about as many people as a typical group of the same number of states.
Each ratifying group is compared with every possible group of the same number of states. On average it held 1.7 points more than the median group; it held more in 11 of 18 events and fewer in 7. The 27th Amendment's group held fewer people than 98.6% of same-size groups.
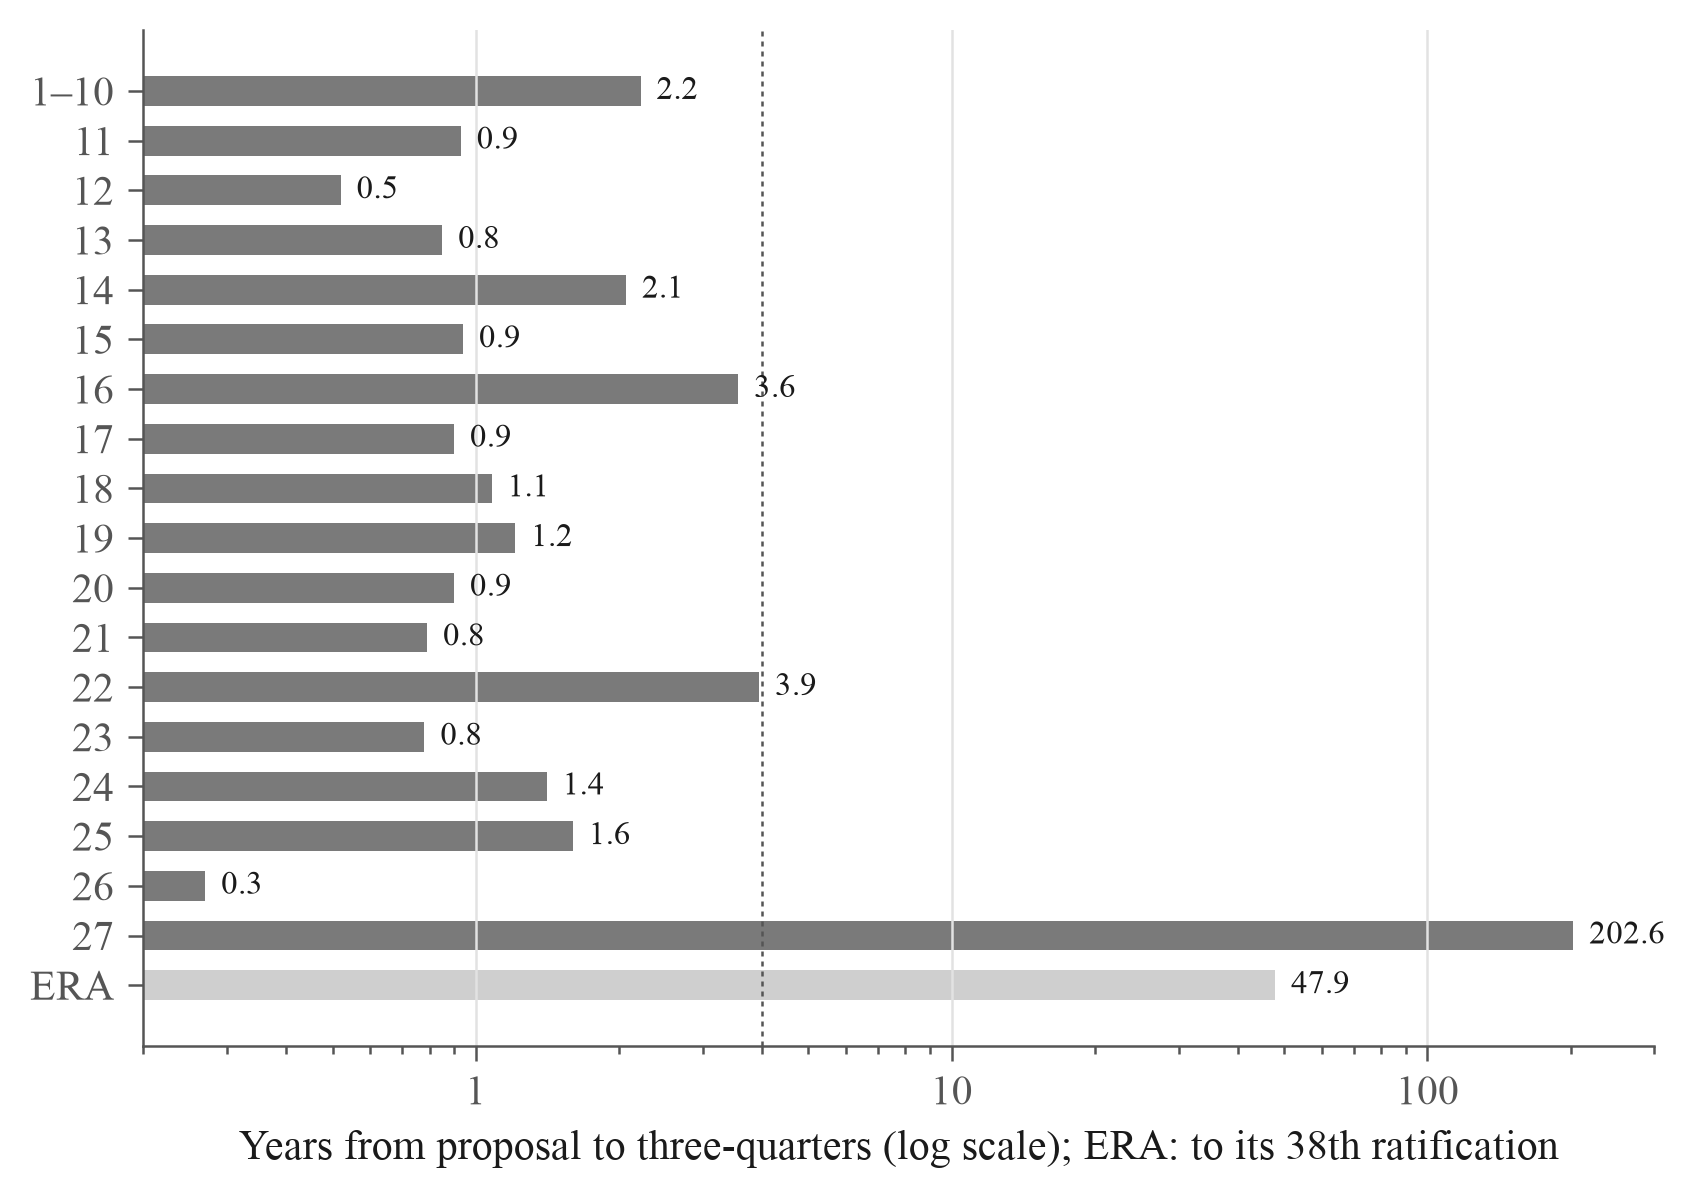
Seventeen of 18 amendments were adopted within four years of proposal; the 27th took 202.6 years.
The 27th was proposed in 1789 with the Bill of Rights and reached three-quarters in 1992. The ERA reached 38 states 47.9 years after proposal.
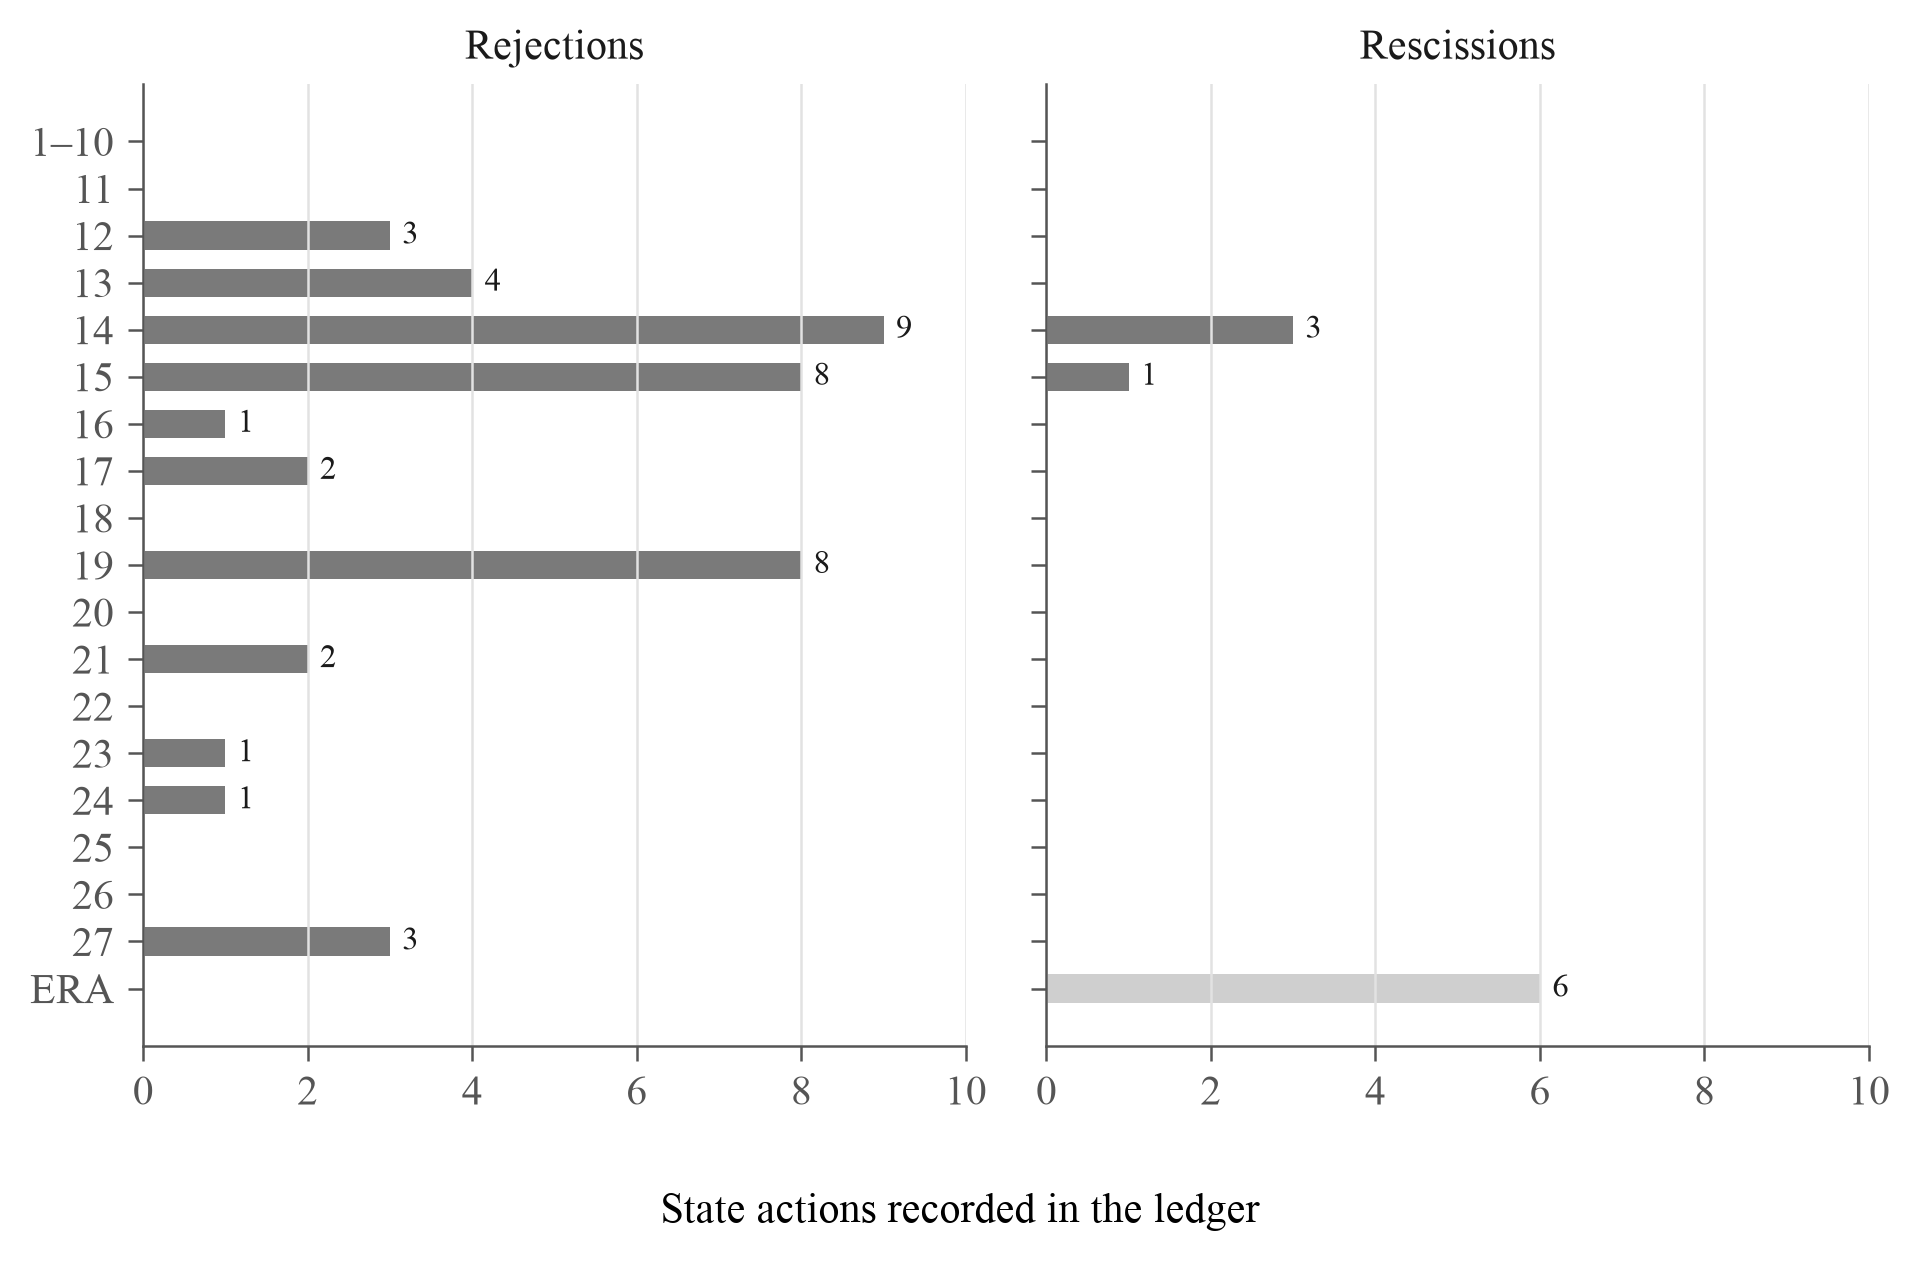
Eleven of 18 amendments were rejected by at least one state; three drew rescissions.
The 14th drew the most rejections (9). Rescissions were recorded against the 14th (3), the 15th (1), and the ERA (6).
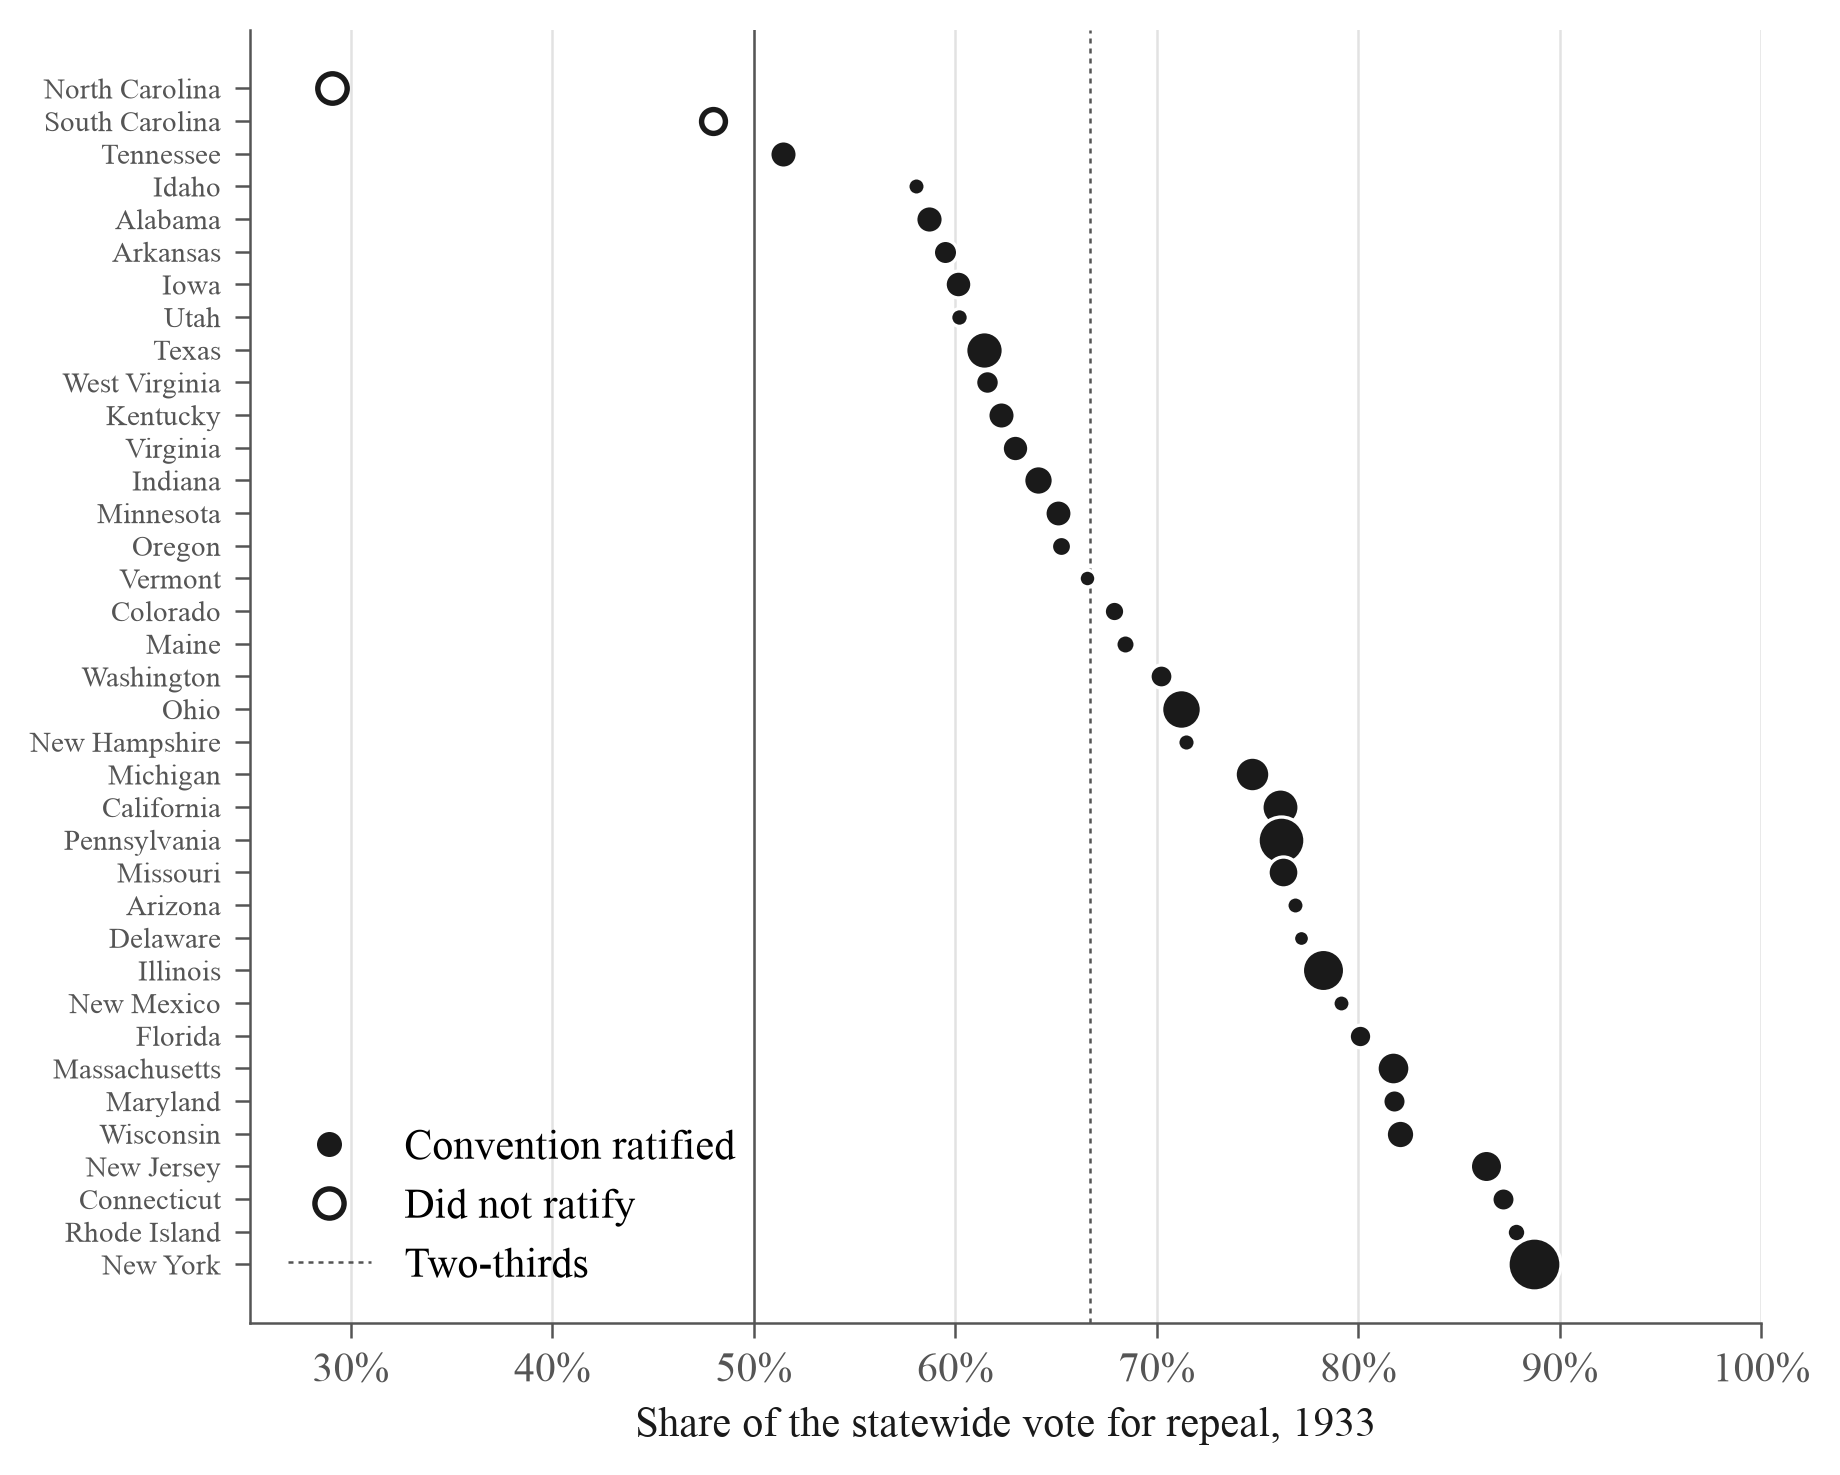
For the 21st Amendment, ratifying states held 95.4% of the population counted by state, and 72.2% counted by votes.
The 21st is the only amendment ratified by elected conventions, so statewide votes exist for 37 states. Counted by state, each ratifying state's full population counts. Counted by votes, each state's population is weighted by its share voting for repeal. Fourteen of 35 ratifying states with vote counts ratified on less than two-thirds. South Carolina and North Carolina voted against repeal and did not ratify.
Data-handling choices move 12 of 18 threshold shares by less than one point.
The 14th (68.0% to 88.9%) and the 15th (72.8% to 85.4%) move most, because they depend on whether the ex-Confederate states count in the union and whether rescissions count. Each bar spans 24 combinations: two denominators, three census interpolations, rescissions counted or not, and two boundary conventions.

What records exist
For 7 of 18 ratification events, the decisive state's record contains no vote tally.
The journals record passage by voice vote, unanimous consent, or suspension of the rules. For four more, only one of two chambers has a tally. The decisive state is the one whose ratification crossed three-quarters; where several acted the same day, one is shown.

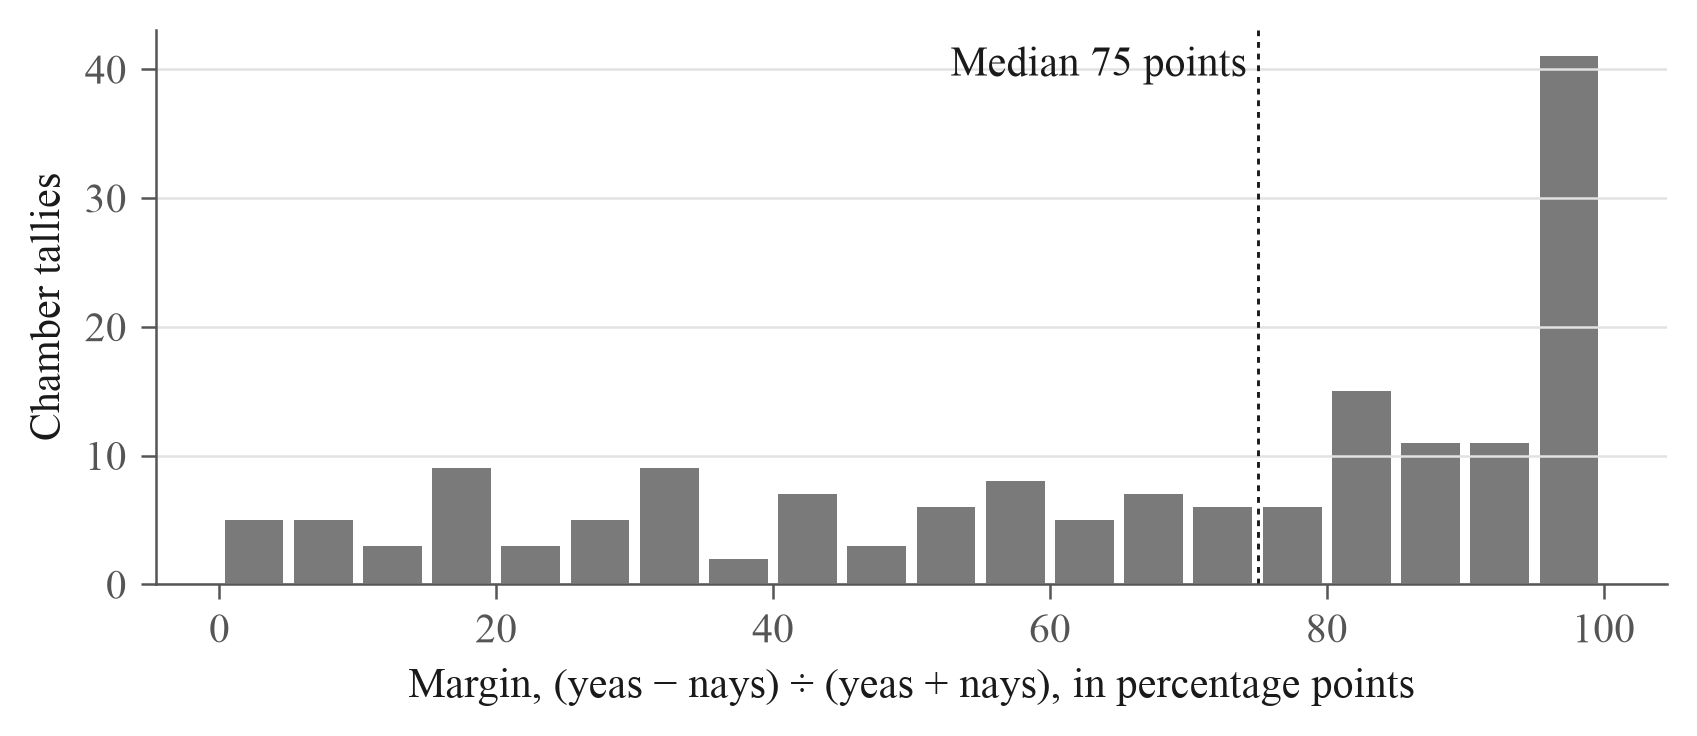
Where state ratification tallies exist, the median margin is 75 points.
Of 167 recorded chamber tallies on ratification, 34 were unanimous and 10 had margins under 10 points. The narrowest recorded ratifications include Ohio's senate on the 15th (19–18) and Tennessee's house on the 19th (49–47). No compiled dataset of state-legislature ratification votes existed before this one; the only machine-readable one covers the ERA.
Prior work
These results reproduce 36 of Peter Suber's 40 hand-calculated values to within 0.1 point.
Suber published both floors for the 20 censuses from 1790 to 1980 (20 U. Mich. J.L. Reform 409, 1987), using the states in the union on January 1 of each census year. The largest difference, 1.5 points in the 1900 ratification floor, comes from a 2,000,000-person subtotal error in his appendix.

How measurement choices compare
Population, votes, and income measures move together across ratifications; land shares move differently.
Each value is the correlation between two measures of the actual ratifying coalitions across amendments. These are descriptive associations; they do not establish that one measure is more appropriate than another.
| Measure pair | Correlation | Amendments compared |
|---|---|---|
| Persons and votes cast | 0.91 | 16 |
| Persons and income | 0.93 | 9 |
| Persons and land area | −0.22 | 28 |
| Votes cast and land area | −0.20 | 16 |
| Income and land area | −0.29 | 9 |
The 27th Amendment and the Equal Rights Amendment change order only when coalitions are measured by land area.
Across 24 specifications each for persons, votes cast, income, and apportionment persons, the ERA's 38-state coalition has a higher measured share than the 27th Amendment's. By land area, the ordering reverses: the 27th's ratifying states account for 85.6% of land. This comparison describes the recorded coalitions under different measures; the ERA did not become part of the Constitution.